using data to predict probability
Hey everyone,
Here we do again this time let's figure out how to display and how to figure out probability. Two exciting topics we may use in our everyday lives.
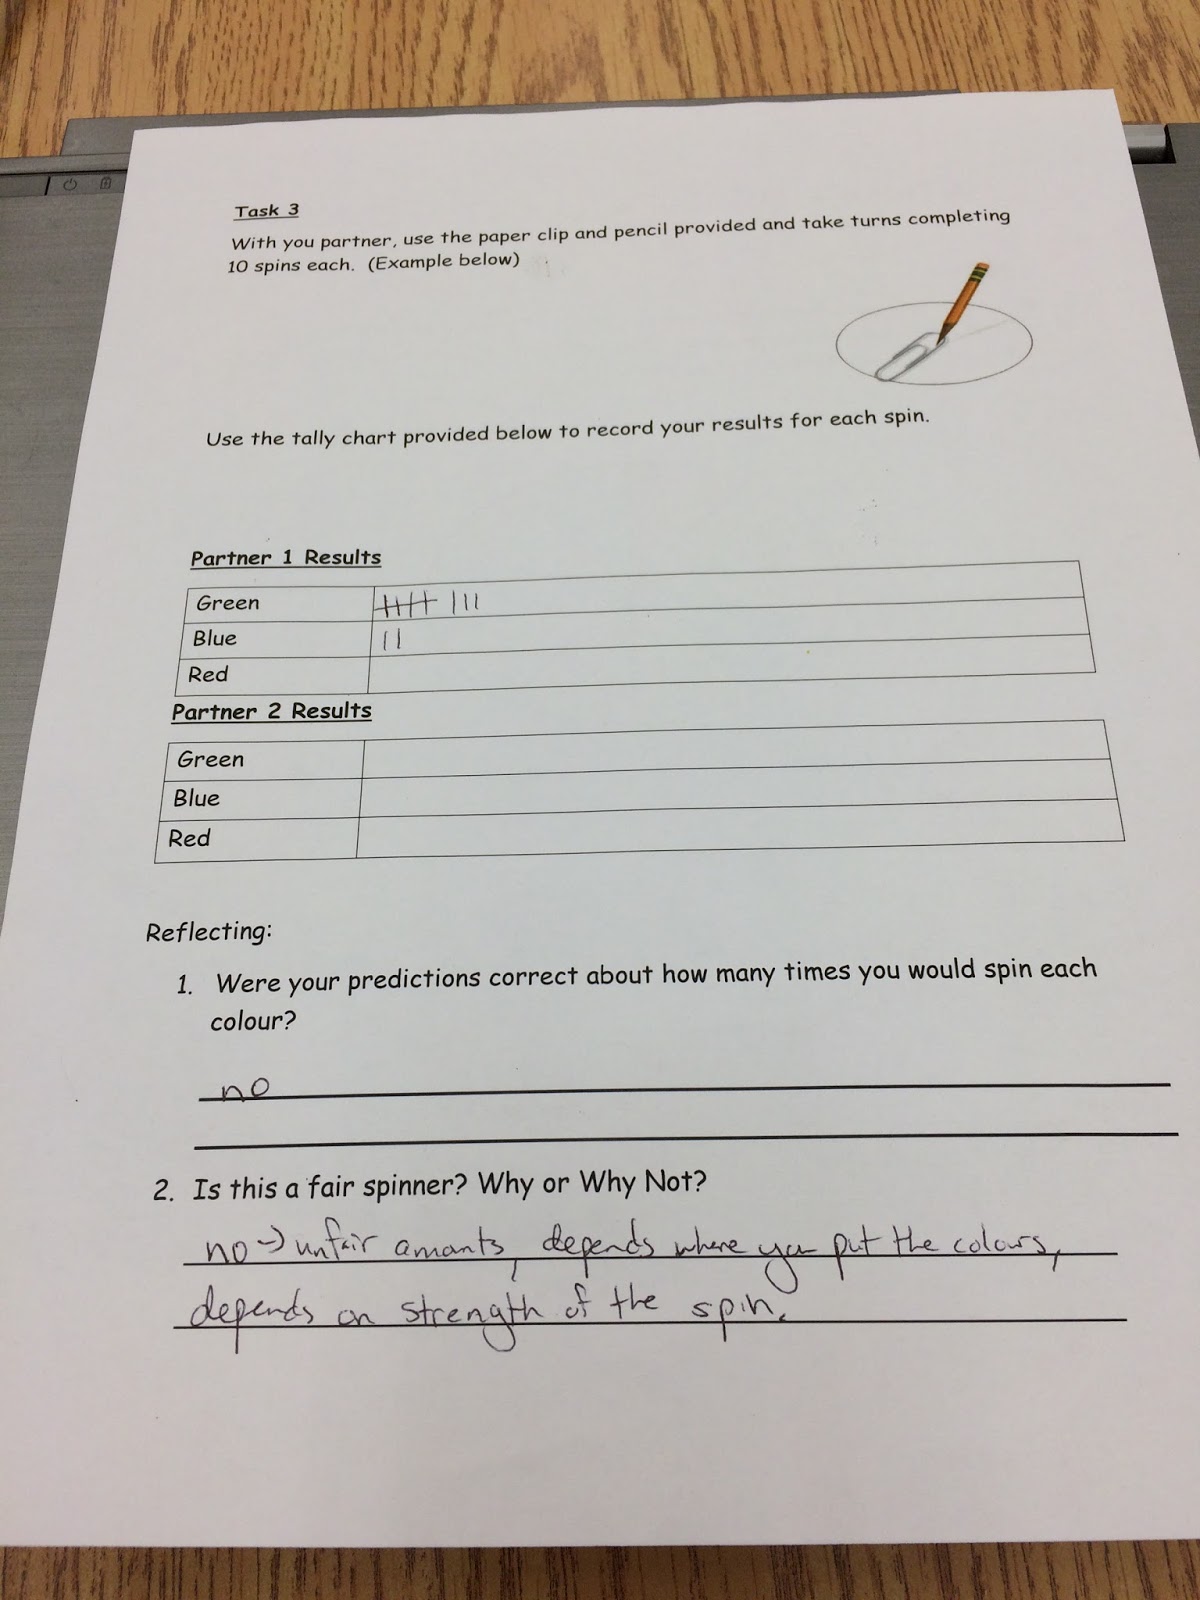
In our groups today Tyler did a wonderful display of probability using a spinner. He developed a game that was appropriate for grade 5 students. He is using an unfair spinner to figure out what the probability would be of landing on each colour. He picked 3 colours with different variables of all. This made it an unfair spinner. To make it fair when first learning you could make the spinner have all equal colours on the spinner. The exercise was then to see after 10 spins how many variables you land on to see if your predictions were right. In our case they were not right as I landed more on green than any other colour. To add in another part of the curriculum students could make the spinners into an art project that included patterns or designs to make it much more fun to integrate.
Brooke used mystery bags to figure out probability. She had one bag filled with equal numbers of two coloured blocks, a second bag of an unequal number of two coloured blocks, and a third bag that included two different coloured blocks and lollipops. For each bag you didn't know which would contain each component so as you pulled the variables out you would guess which probability belonged to which bag. This showed the idea of using impossible or certain variables of math to determine probability.
Connor used a number line. He completed the date on the number line. He used 5 different colours of paper (red, blue, purple, pink, and black) and put them in a bag. He pulled the different coloured papers out to see what the probability of pulling each one would be.
To go back to the idea of data we looked at many different ways to display date which are found throughout our text. We used the data set to the right to create bar graphs on the data. Pg. 594 talks about how to display a bar graph. This can be displayed using patterns or colours; depending on how you want to represent it. Our class did a few different examples pictured below. One group also included a line graph which is another way to represent data.
Pie Graphs or pie charts
are another way in which data can be displayed. This is commonly used to show a "relationship among the parts of a whole, and at the same time, show relationships between each part and the whole"(pg. 603). In order to represent each data you will need to make sure that the degrees are accurate in order to show a proper data set. To get the degrees of the circle you must divide the data number by the whole number and then multiply by 360 to get the degrees needed to represent your data in a circle. So for example if the data was showing 4 out of 20 kids liked romantic comedies you must divide 4/20 and multiple by 360. This will give you 72 degrees on the pie chart.
There are three measures of central tendency when it comes to expressing some of the data as a single meaningful number.
First we look at mean (pg. 582) which the value of a data set that would result form putting all of the values together and distributing them evenly. To calculate this you must add all the values up and divide by the total number of values.
Median (pg 584) is used to describe a set of data with a single value. To calculate median you would line the numbers up in order from smallest to largest and find the exact middle number. If odd number of values it is the exact middle. If even number of values it is the average of the two middle numbers.
Mode (pg. 585) is to describe the most frequent value in the data set. For this you just write down the number that is repeated the most amount of times. If more than one you write down both.
As we go around full circle we get back to probability. In order to calculate probability we must use a formula which is P (A) = numbers of ways even can occur/total number of possible outcomes.
For example:
Data set: 1, 2, 3, 4, 5. Probability of getting any number is 1/5 since you have an even chance of getting any number. Probability of getting an even number is 2/5 since there are 2 even numbers. Probability of getting an odd number is 3/5 since there are 3 odd numbers.
Hope this was fun. Join us next time as we delve into the world of using technology to enhance our understanding of math.
 |
| Doucette, K. Nov. 17th 2017. "Winner Winner, Lucky Spinner." Retrieved from own personal library |
In our groups today Tyler did a wonderful display of probability using a spinner. He developed a game that was appropriate for grade 5 students. He is using an unfair spinner to figure out what the probability would be of landing on each colour. He picked 3 colours with different variables of all. This made it an unfair spinner. To make it fair when first learning you could make the spinner have all equal colours on the spinner. The exercise was then to see after 10 spins how many variables you land on to see if your predictions were right. In our case they were not right as I landed more on green than any other colour. To add in another part of the curriculum students could make the spinners into an art project that included patterns or designs to make it much more fun to integrate.
 |
| Doucette, K. Nov. 17th 2017. "Part two" Retrieved from own personal library |
Connor used a number line. He completed the date on the number line. He used 5 different colours of paper (red, blue, purple, pink, and black) and put them in a bag. He pulled the different coloured papers out to see what the probability of pulling each one would be.
 |
| Doucette, K. Nov. 17th 2017. "Data set" Retrieved from own personal library |
Pie Graphs or pie charts
are another way in which data can be displayed. This is commonly used to show a "relationship among the parts of a whole, and at the same time, show relationships between each part and the whole"(pg. 603). In order to represent each data you will need to make sure that the degrees are accurate in order to show a proper data set. To get the degrees of the circle you must divide the data number by the whole number and then multiply by 360 to get the degrees needed to represent your data in a circle. So for example if the data was showing 4 out of 20 kids liked romantic comedies you must divide 4/20 and multiple by 360. This will give you 72 degrees on the pie chart.
 |
| Doucette, K. Nov. 17th 2017. "Bar Graphs." Retrieved from own personal library |
First we look at mean (pg. 582) which the value of a data set that would result form putting all of the values together and distributing them evenly. To calculate this you must add all the values up and divide by the total number of values.
Median (pg 584) is used to describe a set of data with a single value. To calculate median you would line the numbers up in order from smallest to largest and find the exact middle number. If odd number of values it is the exact middle. If even number of values it is the average of the two middle numbers.
Mode (pg. 585) is to describe the most frequent value in the data set. For this you just write down the number that is repeated the most amount of times. If more than one you write down both.
As we go around full circle we get back to probability. In order to calculate probability we must use a formula which is P (A) = numbers of ways even can occur/total number of possible outcomes.
For example:
Data set: 1, 2, 3, 4, 5. Probability of getting any number is 1/5 since you have an even chance of getting any number. Probability of getting an even number is 2/5 since there are 2 even numbers. Probability of getting an odd number is 3/5 since there are 3 odd numbers.
Hope this was fun. Join us next time as we delve into the world of using technology to enhance our understanding of math.


Comments
Post a Comment